Home
Understanding the Electrocardiogram

Main navigation

  • Home
  • Understanding ECGs
    • Introduction
User account menu
  • Log in

Breadcrumb

  1. Home
  2. Understanding the Electrocardiogram In Health & Disease
  3. 8.0.0 The Bradycardias frame i-introduction
  4. 8.2.0 SA Block (frame 41)

8.2.10 (frame 51)

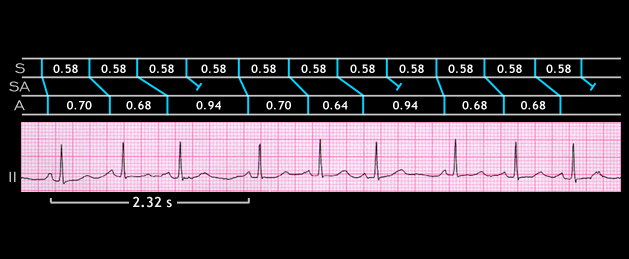
The interval between the sinus node discharges, i.e. the sinus node cycle length or SS interval, determined by dividing the interval between the first P weave of each group (2.32.seconds) by the number of P waves in this envelope (4) is 0.58 seconds, a rate of 104 per minute. The assumed location of the sinus node discharge to the onset of atrial activation (the onset of the P wave) in the first beat of the group is shown in the ladder diagram. This demonstrates the progressive lengthening of the SA interval prior to the block.

Book traversal links for 8.2.10 (frame 51)

  • 8.2.9 (50)
  • Up
  • 8.2.11 (52)

Site is under construction

Book navigation

  • Introduction to First Edition
  • 1.0.0 Generation of the ECG
  • 2.0.0 The Normal Electrocardiogram
  • 3.0.0 Inter and intra-ventricular Conduction Disturbances
  • 4.0.0 Ventricular Hypertrophy
  • 5.0.0 ELECTROLYTE ABNORMALITIES, DRUG EFFECTS AND THE LONG QT SYNDROMES
  • 6.0.0 Ischemia and Infarction - Introduction (frame i and ii)
  • 7.0.0 Tachycardias- Introduction
  • 8.0.0 The Bradycardias frame i-introduction
    • 8.1.0 Sinus Bradycardia and AV block (frame 1)
    • 8.2.0 SA Block (frame 41)
      • 8.2.1 (42)
      • 8.2.2 (43)
      • 8.2.3(44)
      • 8.2.4 (45)
      • 8.2.5 (46)
      • 8.2.6 (47)
      • 8.2.7 (48)
      • 8.2.8 (49)
      • 8.2.9 (50)
      • 8.2.10 (frame 51)
      • 8.2.11 (52)
      • 8.2.12 (53)
      • 8.2.13 (54)
      • 8.2.14 (55)
      • 8.2.15 (56)
    • 8.3.0 Group Beating (frame 57)
  • 9.0.0 The ECG of Heart Murmurs-introduction
  • 10.0.0 The Electrocardiogram in the Emergency Department-Introduction
Powered by Drupal