Home
Understanding the Electrocardiogram

Main navigation

  • Home
  • Understanding ECGs
    • Introduction
User account menu
  • Log in

Breadcrumb

  1. Home
  2. Understanding the Electrocardiogram In Health & Disease
  3. 6.0.0 Ischemia and Infarction - Introduction (frame i and ii)
  4. 6.1.0 ST Segment (frame1)
  5. 6.1.30 (frame 30)

6.1.33(33)

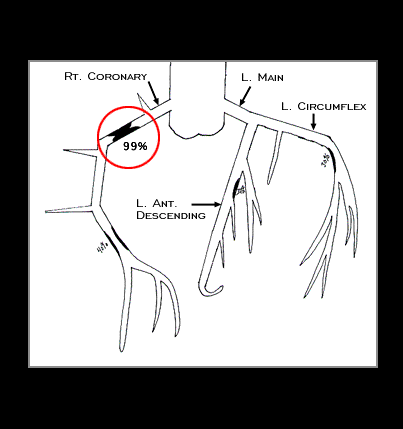
Her coronary angiogram, depicted here, revealed complete occlusion of the right coronary artery in its proximal portion.

Book traversal links for 6.1.33(33)

  • 6.1.32 (32)
  • Up
  • 6.1.34 (34)

Site is under construction

Book navigation

  • Introduction to First Edition
  • 1.0.0 Generation of the ECG
  • 2.0.0 The Normal Electrocardiogram
  • 3.0.0 Inter and intra-ventricular Conduction Disturbances
  • 4.0.0 Ventricular Hypertrophy
  • 5.0.0 ELECTROLYTE ABNORMALITIES, DRUG EFFECTS AND THE LONG QT SYNDROMES
  • 6.0.0 Ischemia and Infarction - Introduction (frame i and ii)
    • 6.1.0 ST Segment (frame1)
      • 6.1.1 (2)
      • 6.1.2(3)
      • 6.1.3(4)
      • 6.1.4(5)
      • 6.1.5(6)
      • 6.1.6 (7)
      • 6.1.7 (8)
      • 6.1.8 (new frame)
      • 6.1.9 (9)
      • 6.1.10 (frame 10)
      • 6.1.20 (frame 20)
      • 6.1.30 (frame 30)
        • 6.1.31 (31)
        • 6.1.32 (32)
        • 6.1.33(33)
        • 6.1.34 (34)
        • 6.1.35 (35)
        • 6.1.36 (36)
        • 6.1.37 (THIS IS A NEW FRAME)
        • 6.1.38 (37)
        • 6.1.39 (38)
      • 6.1.40 (frame 39)
      • 6.1.50 (49)
    • 6.2.0 Q WAVES (frame 53)
    • 6.3.0 T WAVES (frame 75)
    • 6.4.0 (Bundle Branch Blocks and othe IVCDs--frame 87)
    • 6.5.0 (frame 106) FALSE POSITIVES
  • 7.0.0 Tachycardias- Introduction
  • 8.0.0 The Bradycardias frame i-introduction
  • 9.0.0 The ECG of Heart Murmurs-introduction
  • 10.0.0 The Electrocardiogram in the Emergency Department-Introduction
Powered by Drupal