
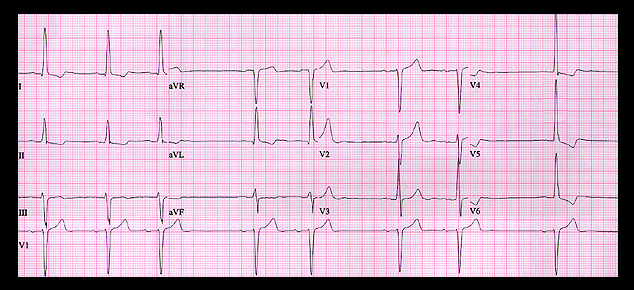
The ECG shown here is from a 68 year old female with known hypertension. She presented to the Emergency Department complaining of “funny spells” and weakness. Her physical examination was unremarkable excerpt for an irregular rhythm.
The tracing shows the increased QRS voltage and changes in the ST segment and T wave that are indicative of LVH. But what is the rhythm? Some may find it helpful to visualize the rhythm by constructing a ladder diagram before going to the next page.