Home
Understanding the Electrocardiogram

Main navigation

  • Home
  • Understanding ECGs
    • Introduction
User account menu
  • Log in

Breadcrumb

  1. Home
  2. Understanding the Electrocardiogram In Health & Disease
  3. 10.0.0 The Electrocardiogram in the Emergency Department-Introduction
  4. 10.4.0 confusion, weakness etc (frame 40)

10.4.12 (52)

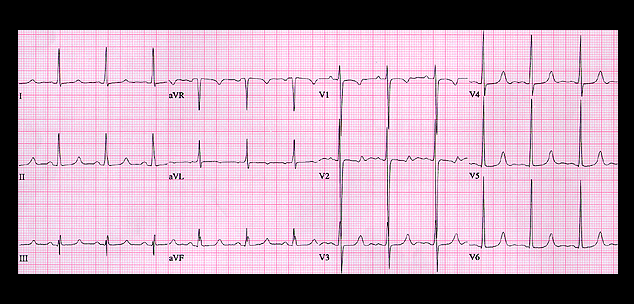
This ECG is from the same patient. It was recorded just after dialysis. At this time, her serum K+ had fallen to 5.1mM but the serum Ca++ remained low (7.9 mg/dl). The PR interval, QRS duration and T waves are now normal but the QT interval remains prolonged (460 msec) with a corrected QT interval of 500 msec.

Book traversal links for 10.4.12 (52)

  • 10.4.11 (50-again)
  • Up
  • 10.4.13 (53)

Site is under construction

Book navigation

  • Introduction to First Edition
  • 1.0.0 Generation of the ECG
  • 2.0.0 The Normal Electrocardiogram
  • 3.0.0 Inter and intra-ventricular Conduction Disturbances
  • 4.0.0 Ventricular Hypertrophy
  • 5.0.0 ELECTROLYTE ABNORMALITIES, DRUG EFFECTS AND THE LONG QT SYNDROMES
  • 6.0.0 Ischemia and Infarction - Introduction (frame i and ii)
  • 7.0.0 Tachycardias- Introduction
  • 8.0.0 The Bradycardias frame i-introduction
  • 9.0.0 The ECG of Heart Murmurs-introduction
  • 10.0.0 The Electrocardiogram in the Emergency Department-Introduction
    • 10.1.0 Chest pain (1)
    • 10.2.0 Shortness of breath (frame 23)
    • 10.3.0 Palpitations (frame 31)
    • 10.4.0 confusion, weakness etc (frame 40)
      • 10.4.1 (40-again)
      • 10.4.2 (42)
      • 10.4.3 (43)
      • 10.4.4 (44)
      • 10.4.5 (45)
      • 10.4.6 (46)
      • 10.4.7 (47)
      • 10.4.8 (47-again)
      • 10.4.9 (49)
      • 10.4.10 (50)
      • 10.4.11 (50-again)
      • 10.4.12 (52)
      • 10.4.13 (53)
      • 10.4.14 (53-again)
      • 10.4.15 (55)
      • 10.4.16 (56)
      • 10.4.17 (56-again)
      • 10.4.18- (no image, only text)
    • 10.5.0 Conclusion (no image)
Powered by Drupal