
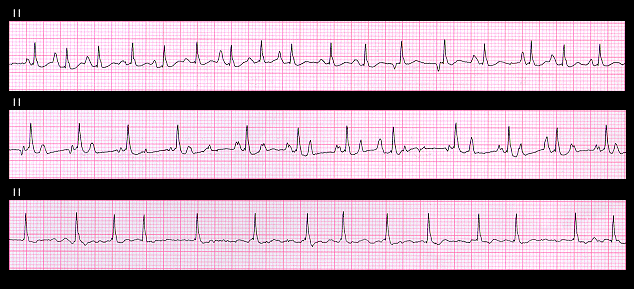
This figure shows lead II rhythm strips recorded from the same patient on 3 different occasions. The upper tracing shows MAT with 1:1 conduction of the P waves. The shortest PP interval is 0.32 seconds. The middle strip shows an increase in the atrial rate. The shortest PP interval is now in the range of 0.24 seconds, there are varying degrees of AV block and some P waves are not conducted to the ventricles. The lower strip, recorded a few days later, shows atrial fibrillation.