Home
Understanding the Electrocardiogram

Main navigation

  • Home
  • Understanding ECGs
    • Introduction
User account menu
  • Log in

Breadcrumb

  1. Home
  2. Understanding the Electrocardiogram In Health & Disease
  3. 7.0.0 Tachycardias- Introduction
  4. 7.2.0 Narrow Complex Rhythms (frame 38)
  5. 7.2.30 (frame 68)

7.2.32 (70)

A unique form of an ectopic atrial rhythm is sometimes seen in patients who are heart transplant recipients. In these patients it is sometimes possible to see 2 P waves on the electrocardiogram. One P wave is from the sinus node that is located within the atrial remnant of the original heart. It does not conduct to the ventricles because its propagation is blocked by the suture line. The second P wave is from the transplanted, or donor heart and it does conduct through the AV node to the ventricles.

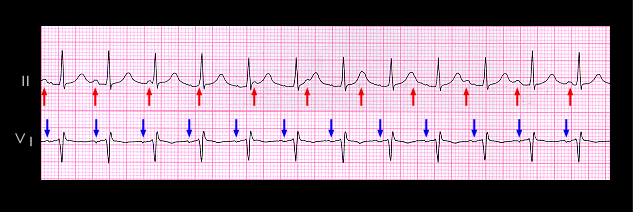
Shown here are simultaneously recorded leads II and V1 of a 41 year old patient following a successful heart transplant. The P waves from the sinus node and atrial remnant of the patient’s original heart are best seen in lead II and are identified by the red arrows. They do not conduct to the ventricle and are therefore dissociated from the QRS complexes. The P waves from the transplanted (donor) heart are seen best in lead V1 (blue arrows). They each conduct to the ventricles with a PR interval of 0.14 seconds. Note that the P-P interval of the conducted P waves from the transplanted heart (0.56 sec) is slightly shorter than the P-P interval of the non-conducted P waves from the atrial remnant (0.6 sec); i.e. the rate of the conducted P waves from the transplanted hear (107 beats/min) is slightly faster than that of the non-conducted P waves (100 beats/min).

Book traversal links for 7.2.32 (70)

  • 7.2.31 (69)
  • Up
  • 7.2.33 (71)

Site is under construction

Book navigation

  • Introduction to First Edition
  • 1.0.0 Generation of the ECG
  • 2.0.0 The Normal Electrocardiogram
  • 3.0.0 Inter and intra-ventricular Conduction Disturbances
  • 4.0.0 Ventricular Hypertrophy
  • 5.0.0 ELECTROLYTE ABNORMALITIES, DRUG EFFECTS AND THE LONG QT SYNDROMES
  • 6.0.0 Ischemia and Infarction - Introduction (frame i and ii)
  • 7.0.0 Tachycardias- Introduction
    • 7.1.0 Mechanisms of arrhythmias-frame 1
    • 7.2.0 Narrow Complex Rhythms (frame 38)
      • 7.2.1 (39)
      • 7.2.2 (FRAME 40)
      • 7.2.3 (41)
      • 7.2.4 (42)
      • 7.2.5 (43)
      • 7.2.6 (44)
      • 7.2.7 (45)
      • 7.2.8 (46)
      • 7.2.9 (47)
      • 7.2.10 (frame 48)
      • 7.2.20 (frame 58)
      • 7.2.30 (frame 68)
        • 7.2.31 (69)
        • 7.2.32 (70)
        • 7.2.33 (71)
        • 7.2.34 (72)
        • 7.2.35 (73)
        • 7.2.36 (74)
        • 7.2.37 (75)
        • 7.2.38 (76)
        • 7.2.39 (77)
      • 7.2.40 (frame 78)
      • 7.2.50 (frame 88)
    • 7.3.0 Atrial Flutter and Fibrillation (frame 93)
    • 7.4.0 Wide Complex Beats and Rhythms (frame 122)
  • 8.0.0 The Bradycardias frame i-introduction
  • 9.0.0 The ECG of Heart Murmurs-introduction
  • 10.0.0 The Electrocardiogram in the Emergency Department-Introduction
Powered by Drupal