Home
Understanding the Electrocardiogram

Main navigation

  • Home
  • Understanding ECGs
    • Introduction
User account menu
  • Log in

Breadcrumb

  1. Home
  2. Understanding the Electrocardiogram In Health & Disease
  3. 7.0.0 Tachycardias- Introduction
  4. 7.2.0 Narrow Complex Rhythms (frame 38)

7.2.3 (41)

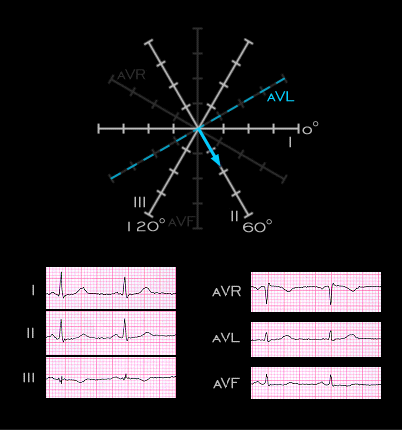
The P wave in this ECG has a frontal plane axis of +60 degrees (the blue arrow). It is 1mm positive in leads I and III and 2mm positive in lead II (remember that I +III = II). Notice also that the P wave is nearly flat, or isoelectric, in lead aVL indicating that the P wave axis is perpendicular to the axis of aVL.

Book traversal links for 7.2.3 (41)

  • 7.2.2 (FRAME 40)
  • Up
  • 7.2.4 (42)

Site is under construction

Book navigation

  • Introduction to First Edition
  • 1.0.0 Generation of the ECG
  • 2.0.0 The Normal Electrocardiogram
  • 3.0.0 Inter and intra-ventricular Conduction Disturbances
  • 4.0.0 Ventricular Hypertrophy
  • 5.0.0 ELECTROLYTE ABNORMALITIES, DRUG EFFECTS AND THE LONG QT SYNDROMES
  • 6.0.0 Ischemia and Infarction - Introduction (frame i and ii)
  • 7.0.0 Tachycardias- Introduction
    • 7.1.0 Mechanisms of arrhythmias-frame 1
    • 7.2.0 Narrow Complex Rhythms (frame 38)
      • 7.2.1 (39)
      • 7.2.2 (FRAME 40)
      • 7.2.3 (41)
      • 7.2.4 (42)
      • 7.2.5 (43)
      • 7.2.6 (44)
      • 7.2.7 (45)
      • 7.2.8 (46)
      • 7.2.9 (47)
      • 7.2.10 (frame 48)
      • 7.2.20 (frame 58)
      • 7.2.30 (frame 68)
      • 7.2.40 (frame 78)
      • 7.2.50 (frame 88)
    • 7.3.0 Atrial Flutter and Fibrillation (frame 93)
    • 7.4.0 Wide Complex Beats and Rhythms (frame 122)
  • 8.0.0 The Bradycardias frame i-introduction
  • 9.0.0 The ECG of Heart Murmurs-introduction
  • 10.0.0 The Electrocardiogram in the Emergency Department-Introduction
Powered by Drupal