Home
Understanding the Electrocardiogram

Main navigation

  • Home
  • Understanding ECGs
    • Introduction
User account menu
  • Log in

Breadcrumb

  1. Home
  2. Understanding the Electrocardiogram In Health & Disease
  3. 6.0.0 Ischemia and Infarction - Introduction (frame i and ii)
  4. 6.3.0 T WAVES (frame 75)

6.3.6 (81)

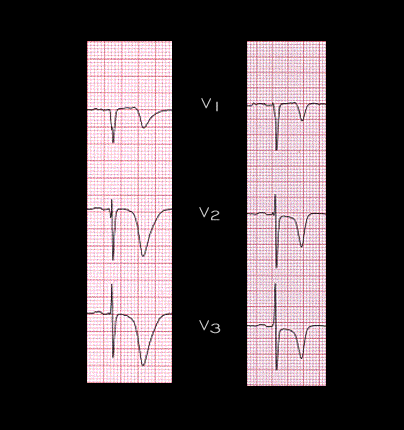
The widened T wave and marked prolongation of the QT interval may be related to changes in sympathetic innervation and stimulation within and distal to the ischemia zone. These changes usually resolve within 48 to 72 hours. Shown here on the left are leads V2, V3 and V4 from the preceding page and the same leads from the tracing taken 48 hours later (right). The T waves remain deeply inverted but the QT interval, which is 0.60 seconds (600ms) in the tracing on the left, has shortened to 0.46 seconds (460ms).

Book traversal links for 6.3.6 (81)

  • 6.3.5 (80)
  • Up
  • 6.3.7 (82)

Site is under construction

Book navigation

  • Introduction to First Edition
  • 1.0.0 Generation of the ECG
  • 2.0.0 The Normal Electrocardiogram
  • 3.0.0 Inter and intra-ventricular Conduction Disturbances
  • 4.0.0 Ventricular Hypertrophy
  • 5.0.0 ELECTROLYTE ABNORMALITIES, DRUG EFFECTS AND THE LONG QT SYNDROMES
  • 6.0.0 Ischemia and Infarction - Introduction (frame i and ii)
    • 6.1.0 ST Segment (frame1)
    • 6.2.0 Q WAVES (frame 53)
    • 6.3.0 T WAVES (frame 75)
      • 6.3.1 (76)
      • 6.3.2 (77)
      • 6.3.3 (78)
      • 6.3.4 (79)
      • 6.3.5 (80)
      • 6.3.6 (81)
      • 6.3.7 (82)
      • 6.3.8 (84) [FRAME 83 OMITTED]
      • 6.3.9 (85)
      • 6.3.10 (frame 86)
    • 6.4.0 (Bundle Branch Blocks and othe IVCDs--frame 87)
    • 6.5.0 (frame 106) FALSE POSITIVES
  • 7.0.0 Tachycardias- Introduction
  • 8.0.0 The Bradycardias frame i-introduction
  • 9.0.0 The ECG of Heart Murmurs-introduction
  • 10.0.0 The Electrocardiogram in the Emergency Department-Introduction
Powered by Drupal