Home
Understanding the Electrocardiogram

Main navigation

  • Home
  • Understanding ECGs
    • Introduction
User account menu
  • Log in

Breadcrumb

  1. Home
  2. Understanding the Electrocardiogram In Health & Disease
  3. 6.0.0 Ischemia and Infarction - Introduction (frame i and ii)
  4. 6.3.0 T WAVES (frame 75)

6.3.3 (78)

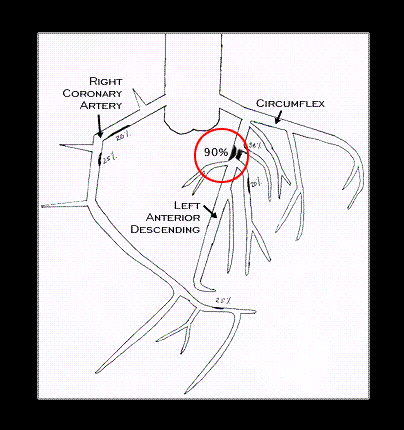
The coronary angiogram of this patient is illustrated here. It demonstrates the almost complete occlusion of the proximal portion of the left anterior descending coronary artery and suggests that the inverted T waves represented post-ischemic T wave changes.

Book traversal links for 6.3.3 (78)

  • 6.3.2 (77)
  • Up
  • 6.3.4 (79)

Site is under construction

Book navigation

  • Introduction to First Edition
  • 1.0.0 Generation of the ECG
  • 2.0.0 The Normal Electrocardiogram
  • 3.0.0 Inter and intra-ventricular Conduction Disturbances
  • 4.0.0 Ventricular Hypertrophy
  • 5.0.0 ELECTROLYTE ABNORMALITIES, DRUG EFFECTS AND THE LONG QT SYNDROMES
  • 6.0.0 Ischemia and Infarction - Introduction (frame i and ii)
    • 6.1.0 ST Segment (frame1)
    • 6.2.0 Q WAVES (frame 53)
    • 6.3.0 T WAVES (frame 75)
      • 6.3.1 (76)
      • 6.3.2 (77)
      • 6.3.3 (78)
      • 6.3.4 (79)
      • 6.3.5 (80)
      • 6.3.6 (81)
      • 6.3.7 (82)
      • 6.3.8 (84) [FRAME 83 OMITTED]
      • 6.3.9 (85)
      • 6.3.10 (frame 86)
    • 6.4.0 (Bundle Branch Blocks and othe IVCDs--frame 87)
    • 6.5.0 (frame 106) FALSE POSITIVES
  • 7.0.0 Tachycardias- Introduction
  • 8.0.0 The Bradycardias frame i-introduction
  • 9.0.0 The ECG of Heart Murmurs-introduction
  • 10.0.0 The Electrocardiogram in the Emergency Department-Introduction
Powered by Drupal