Home
Understanding the Electrocardiogram

Main navigation

  • Home
  • Understanding ECGs
    • Introduction
User account menu
  • Log in

Breadcrumb

  1. Home
  2. Understanding the Electrocardiogram In Health & Disease
  3. 6.0.0 Ischemia and Infarction - Introduction (frame i and ii)
  4. 6.3.0 T WAVES (frame 75)

6.3.5 (80)

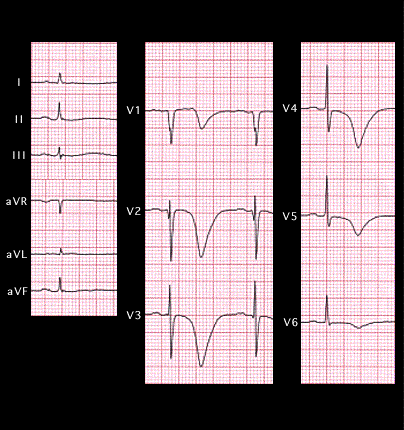
The ECG shown here is from a patient with an enzyme positive ischemic event but without the development of Q waves. The deeply inverted and widened T wave and prolonged QT interval, sometimes referred to as “giant T waves” represents a rather extreme example of the type of T wave change associated with a non-Q-wave, or non-transmural infarction. In this patient there was a high grade lesion in the proximal portion of the left anterior descending coronary artery, similar to that shown for the previous patient.

Book traversal links for 6.3.5 (80)

  • 6.3.4 (79)
  • Up
  • 6.3.6 (81)

Site is under construction

Book navigation

  • Introduction to First Edition
  • 1.0.0 Generation of the ECG
  • 2.0.0 The Normal Electrocardiogram
  • 3.0.0 Inter and intra-ventricular Conduction Disturbances
  • 4.0.0 Ventricular Hypertrophy
  • 5.0.0 ELECTROLYTE ABNORMALITIES, DRUG EFFECTS AND THE LONG QT SYNDROMES
  • 6.0.0 Ischemia and Infarction - Introduction (frame i and ii)
    • 6.1.0 ST Segment (frame1)
    • 6.2.0 Q WAVES (frame 53)
    • 6.3.0 T WAVES (frame 75)
      • 6.3.1 (76)
      • 6.3.2 (77)
      • 6.3.3 (78)
      • 6.3.4 (79)
      • 6.3.5 (80)
      • 6.3.6 (81)
      • 6.3.7 (82)
      • 6.3.8 (84) [FRAME 83 OMITTED]
      • 6.3.9 (85)
      • 6.3.10 (frame 86)
    • 6.4.0 (Bundle Branch Blocks and othe IVCDs--frame 87)
    • 6.5.0 (frame 106) FALSE POSITIVES
  • 7.0.0 Tachycardias- Introduction
  • 8.0.0 The Bradycardias frame i-introduction
  • 9.0.0 The ECG of Heart Murmurs-introduction
  • 10.0.0 The Electrocardiogram in the Emergency Department-Introduction
Powered by Drupal