
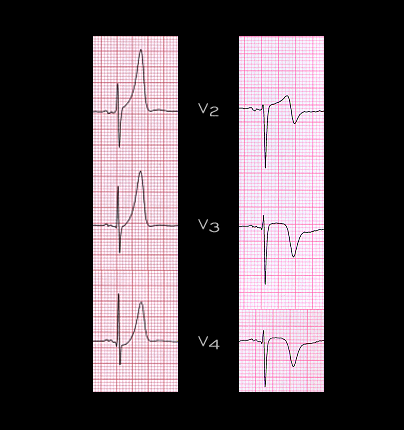
Shown here are leads V2,V3 and V4 from the previous page (left) and from the ECG taken on the same patient the following day (right). The change in the QRS complex, with the loss of R waves and developement of deep S waves in the tracing on the right suggests that the leads may have been placed an interspace lower. However, the slight ST segment elevation and inversion of the T waves reflect the evolution of the T wave changes associated with acute ischemia.