Home
Understanding the Electrocardiogram

Main navigation

  • Home
  • Understanding ECGs
    • Introduction
User account menu
  • Log in

Breadcrumb

  1. Home
  2. Understanding the Electrocardiogram In Health & Disease
  3. 6.0.0 Ischemia and Infarction - Introduction (frame i and ii)
  4. 6.1.0 ST Segment (frame1)
  5. 6.1.20 (frame 20)

6.1.26 (26)

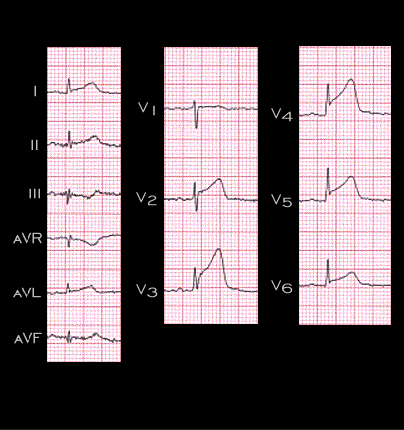
The ECG shown here provides an example of how the lead distribution of ST segment elevation localizes the ischemic region and permits prediction of the involved coronary artery. The tracing reveals elevation of the ST segment (relative to the TQ segment) that is maximum in leads V2, V3, V4 and V5, the anterior chest leads and of lesser magnitude in leads 1, aVL and V6, the left lateral leads. This suggest a large ischemic region involving the anterior and lateral left ventricular walls, the region supplied by the anterior descending coronary artery, and suggests that the ā€œculprit lesionā€ is within this vessel.

Note the fusion of the elevated ST segment with the ascending limb of the T wave which appears somewhat peaked. This is a characteristic ECG feature in the early stages of an acute ischemic event and is often referred to as the hyper-acute phase of an acute myocardial infarction.

Book traversal links for 6.1.26 (26)

  • 6.1.25 (25)
  • Up
  • 6.1.27 (27)

Site is under construction

Book navigation

  • Introduction to First Edition
  • 1.0.0 Generation of the ECG
  • 2.0.0 The Normal Electrocardiogram
  • 3.0.0 Inter and intra-ventricular Conduction Disturbances
  • 4.0.0 Ventricular Hypertrophy
  • 5.0.0 ELECTROLYTE ABNORMALITIES, DRUG EFFECTS AND THE LONG QT SYNDROMES
  • 6.0.0 Ischemia and Infarction - Introduction (frame i and ii)
    • 6.1.0 ST Segment (frame1)
      • 6.1.1 (2)
      • 6.1.2(3)
      • 6.1.3(4)
      • 6.1.4(5)
      • 6.1.5(6)
      • 6.1.6 (7)
      • 6.1.7 (8)
      • 6.1.8 (new frame)
      • 6.1.9 (9)
      • 6.1.10 (frame 10)
      • 6.1.20 (frame 20)
        • 6.1.21 (21)
        • 6.1.22 (22)
        • 6.1.23 (23)
        • 6.1.24 (24)
        • 6.1.25 (25)
        • 6.1.26 (26)
        • 6.1.27 (27)
        • 6.1.28 (28)
        • 6.1.29 (29)
      • 6.1.30 (frame 30)
      • 6.1.40 (frame 39)
      • 6.1.50 (49)
    • 6.2.0 Q WAVES (frame 53)
    • 6.3.0 T WAVES (frame 75)
    • 6.4.0 (Bundle Branch Blocks and othe IVCDs--frame 87)
    • 6.5.0 (frame 106) FALSE POSITIVES
  • 7.0.0 Tachycardias- Introduction
  • 8.0.0 The Bradycardias frame i-introduction
  • 9.0.0 The ECG of Heart Murmurs-introduction
  • 10.0.0 The Electrocardiogram in the Emergency Department-Introduction
Powered by Drupal