Home
Understanding the Electrocardiogram

Main navigation

  • Home
  • Understanding ECGs
    • Introduction
User account menu
  • Log in

Breadcrumb

  1. Home
  2. Understanding the Electrocardiogram In Health & Disease
  3. 5.0.0 ELECTROLYTE ABNORMALITIES, DRUG EFFECTS AND THE LONG QT SYNDROMES
  4. 5.5.0 Drug effects (frame 45)
  5. 5.5.30 (frame 75)

5.5.38 (83)

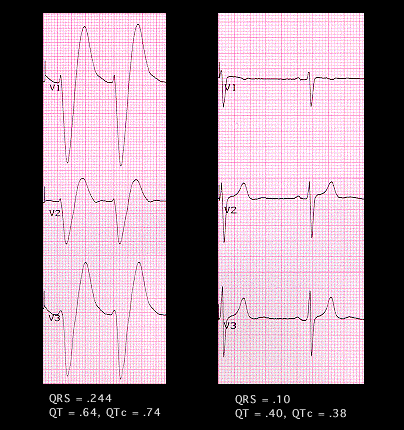
The tracing on the left is the same as that shown on the previous page. The rate is 90 and there may be a sinus P wave at the end of the T wave. The tracing on the right was recorded several days later, following recovery. The rate is now 52, the QRS complex is normal in both shape and duration and the sinus P wave is clearly seen before each QRS complex. The prolongation of the QT and QTc intervals in the tracing on the left is due almost entirely to the QRS prolongation.

Book traversal links for 5.5.38 (83)

  • 5.5.37(82)
  • Up
  • 5.5.39 (84)

Site is under construction

Book navigation

  • Introduction to First Edition
  • 1.0.0 Generation of the ECG
  • 2.0.0 The Normal Electrocardiogram
  • 3.0.0 Inter and intra-ventricular Conduction Disturbances
  • 4.0.0 Ventricular Hypertrophy
  • 5.0.0 ELECTROLYTE ABNORMALITIES, DRUG EFFECTS AND THE LONG QT SYNDROMES
    • 5.1.0 Ion Channel R review (frame 1)
    • 5.2.0 High Potassium (9)
    • 5.2.10 (frame 19)
    • 5.3.0 low potassium (frame 28)
    • 5.4.0 CHANGES IN CALCIUM AND SODIUM (frame 36)
    • 5.5.0 Drug effects (frame 45)
      • 5.5.1 (frame 46)
      • 5.5.2 (47)
      • 5.5.3 (48)
      • 5.5.4(49)
      • 5.5.5(50)
      • 5.5.6 (51)
      • 5.5.7 (52)
      • 5.5.8 (53)
      • 5.5.9 (54)
      • 5.5.10 (55)
      • 5.5.20(frame 65)
      • 5.5.30 (frame 75)
        • 5.5.31 (76)
        • 5.5.32 (77)
        • 5.5.33(78)
        • 5.5.34 (79)
        • 5.5.35(80)
        • 5.5.36 (81)
        • 5.5.37(82)
        • 5.5.38 (83)
        • 5.5.39 (84)
      • 5.5.40 (frame 85)
      • 5.5.50 (frame 95)
    • 5.6.0 (frame 96) Hypothermia
    • 5.7.0 Brugada syndrome frame 116
  • 6.0.0 Ischemia and Infarction - Introduction (frame i and ii)
  • 7.0.0 Tachycardias- Introduction
  • 8.0.0 The Bradycardias frame i-introduction
  • 9.0.0 The ECG of Heart Murmurs-introduction
  • 10.0.0 The Electrocardiogram in the Emergency Department-Introduction
Powered by Drupal