Home
Understanding the Electrocardiogram

Main navigation

  • Home
  • Understanding ECGs
    • Introduction
User account menu
  • Log in

Breadcrumb

  1. Home
  2. Understanding the Electrocardiogram In Health & Disease
  3. 2.0.0 The Normal Electrocardiogram
  4. 2.4.0 ST segment

2.4.2

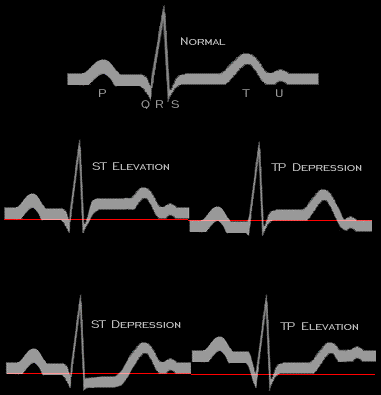
The ST segment is referenced to the TP segment, i.e. the interval from the end of the T wave to the onset of the next P wave, and normally the two are at the same level (are isoelectric). Deviation of either the TP segment or the ST segment will be reflected on the AC coupled body surface ECG as a deviation of the ST segment because the TP segment is automatically centered by the ECG machine. However, if both the TP segment and the ST segment move in the same direction and by the same amount, the ECG will appear normal. In this graphic, the red line represents the normal baseline.

Book traversal links for 2.4.2

  • 2.4.1
  • Up
  • 2.4.3

Site is under construction

Book navigation

  • Introduction to First Edition
  • 1.0.0 Generation of the ECG
  • 2.0.0 The Normal Electrocardiogram
    • 2.1.0 P Wave
    • 2.2.0 PR Interval
    • 2.3.0 QRS Complex
    • 2.4.0 ST segment
      • 2.4.1
      • 2.4.2
      • 2.4.3
    • 2.5.0 T wave
    • 2.6.0 QT Interval
    • 2.7.0 U Wave
  • 3.0.0 Inter and intra-ventricular Conduction Disturbances
  • 4.0.0 Ventricular Hypertrophy
  • 5.0.0 ELECTROLYTE ABNORMALITIES, DRUG EFFECTS AND THE LONG QT SYNDROMES
  • 6.0.0 Ischemia and Infarction - Introduction (frame i and ii)
  • 7.0.0 Tachycardias- Introduction
  • 8.0.0 The Bradycardias frame i-introduction
  • 9.0.0 The ECG of Heart Murmurs-introduction
  • 10.0.0 The Electrocardiogram in the Emergency Department-Introduction
Powered by Drupal