Home
Understanding the Electrocardiogram

Main navigation

  • Home
  • Understanding ECGs
    • Introduction
User account menu
  • Log in

Breadcrumb

  1. Home
  2. Understanding the Electrocardiogram In Health & Disease
  3. 7.0.0 Tachycardias- Introduction
  4. 7.2.0 Narrow Complex Rhythms (frame 38)
  5. 7.2.20 (frame 58)

7.2.24 (62)

The electrocardiographic diagnosis of the atrial tachycardias, be they sinus or ectopic, is more difficult when the P waves fall on the preceding T or U waves. This may occur because of the rate itself, because of a prolonged PR interval and/or because of a prolonged QT/U interval.

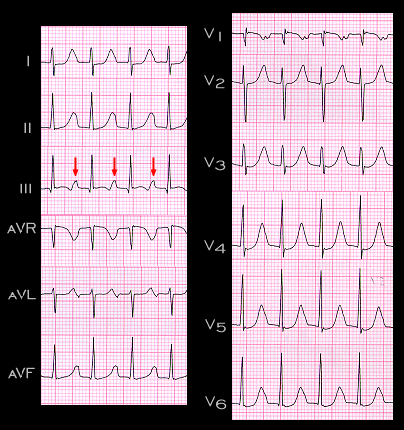
This ECG from a 31 year old female. The rate is about 140/min (RR interval = 0.42 sec). The P waves appear to be upright in leads I, III and negative in aVR, indicating their sinus origin, but they are not obvious in these leads because they are superimposed on the T waves. They are best seen in lead III (arrows) where they are also upright but where they are superimposed on an inverted T wave.. Note that in lead V1, only the negative component of the P wave is obvious. The PR interval is at the upper limit of normal, measuring about 200ms (0.20 sec) and the QT interval, while difficult to measure accurately, appears to be in the range of 360 ms (0.36 sec). When corrected for rate by the Bazett formula, the QT interval exceeds 500 ms and is prolonged. The rhythm in this ECG could by mistaken for an AV nodal tachycardia if the P waves were not identified. The key to its correct diagnosis is to note the distortion of the T waves and to recognize that it is caused by the superimposition of the P waves.

Book traversal links for 7.2.24 (62)

  • 7.2.23 (61)
  • Up
  • 7.2.25 (63)

Site is under construction

Book navigation

  • Introduction to First Edition
  • 1.0.0 Generation of the ECG
  • 2.0.0 The Normal Electrocardiogram
  • 3.0.0 Inter and intra-ventricular Conduction Disturbances
  • 4.0.0 Ventricular Hypertrophy
  • 5.0.0 ELECTROLYTE ABNORMALITIES, DRUG EFFECTS AND THE LONG QT SYNDROMES
  • 6.0.0 Ischemia and Infarction - Introduction (frame i and ii)
  • 7.0.0 Tachycardias- Introduction
    • 7.1.0 Mechanisms of arrhythmias-frame 1
    • 7.2.0 Narrow Complex Rhythms (frame 38)
      • 7.2.1 (39)
      • 7.2.2 (FRAME 40)
      • 7.2.3 (41)
      • 7.2.4 (42)
      • 7.2.5 (43)
      • 7.2.6 (44)
      • 7.2.7 (45)
      • 7.2.8 (46)
      • 7.2.9 (47)
      • 7.2.10 (frame 48)
      • 7.2.20 (frame 58)
        • 7.2.21 (59)
        • 7.2.22 (60)
        • 7.2.23 (61)
        • 7.2.24 (62)
        • 7.2.25 (63)
        • 7.2.26 (64)
        • 7.2.27 (65)
        • 7.2.28 (66)
        • 7.2.29 (67)
      • 7.2.30 (frame 68)
      • 7.2.40 (frame 78)
      • 7.2.50 (frame 88)
    • 7.3.0 Atrial Flutter and Fibrillation (frame 93)
    • 7.4.0 Wide Complex Beats and Rhythms (frame 122)
  • 8.0.0 The Bradycardias frame i-introduction
  • 9.0.0 The ECG of Heart Murmurs-introduction
  • 10.0.0 The Electrocardiogram in the Emergency Department-Introduction
Powered by Drupal