Home
Understanding the Electrocardiogram

Main navigation

  • Home
  • Understanding ECGs
    • Introduction
User account menu
  • Log in

Breadcrumb

  1. Home
  2. Understanding the Electrocardiogram In Health & Disease
  3. 3.0.0 Inter and intra-ventricular Conduction Disturbances
  4. 3.1.0 Right Bundle Branch Block (RBBB)

3.1.14

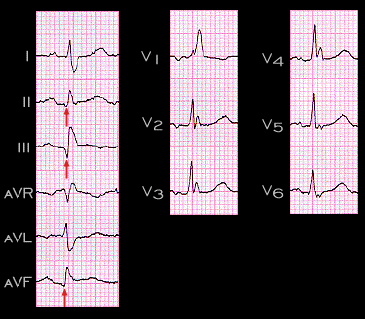
The ECG in this frame also demonstrates right bundle branch block, but the Q waves in leads II, III, and aVF (arrows) are abnormally wide, measuring close to 0.04 seconds.

Book traversal links for 3.1.14

  • 3.1.13
  • Up
  • 3.1.15

Site is under construction

Book navigation

  • Introduction to First Edition
  • 1.0.0 Generation of the ECG
  • 2.0.0 The Normal Electrocardiogram
  • 3.0.0 Inter and intra-ventricular Conduction Disturbances
    • 3.0.1 Introduction Continued
    • 3.1.0 Right Bundle Branch Block (RBBB)
      • 3.1.1
      • 3.1.2
      • 3.1.3
      • 3.1.4
      • 3.1.5
      • 3.1.6
      • 3.1.7
      • 3.1.8
      • 3.1.9
      • 3.1.10
      • 3.1.12. (14)
      • 3.1.13
      • 3.1.14
      • 3.1.15
      • 3.1.16
    • 3.2.0 Left Bundle Branch Block (LBBB)
    • 3.3.0 Fascicular blocks (frame 29)
    • 3.4.0 Aberrant Ventricular Conduction (52)
    • 3.5.0 Ventricular Pre-excitation (77)
  • 4.0.0 Ventricular Hypertrophy
  • 5.0.0 ELECTROLYTE ABNORMALITIES, DRUG EFFECTS AND THE LONG QT SYNDROMES
  • 6.0.0 Ischemia and Infarction - Introduction (frame i and ii)
  • 7.0.0 Tachycardias- Introduction
  • 8.0.0 The Bradycardias frame i-introduction
  • 9.0.0 The ECG of Heart Murmurs-introduction
  • 10.0.0 The Electrocardiogram in the Emergency Department-Introduction
Powered by Drupal