Home
Understanding the Electrocardiogram

Main navigation

  • Home
  • Understanding ECGs
    • Introduction
User account menu
  • Log in

Breadcrumb

  1. Home
  2. Understanding the Electrocardiogram In Health & Disease
  3. 5.0.0 ELECTROLYTE ABNORMALITIES, DRUG EFFECTS AND THE LONG QT SYNDROMES
  4. 5.3.0 low potassium (frame 28)

5.3.5 (33)

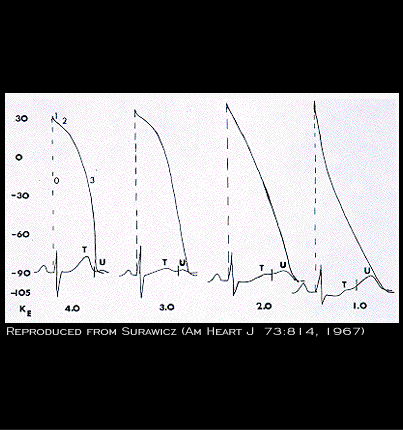
This figure, reproduced (with permission) from the work of Surawicz (Am. Heart J. 73:814.1967), illustrates the correlation between the changes in the ventricular transmembrane action potential and the body surface electrocardiogram as extracellular potassium is decreased in progressive steps from 4.0 to 1.0 mM.

Book traversal links for 5.3.5 (33)

  • 5.3.4 (THIS IS FRAME 34)
  • Up
  • 5.4.0 CHANGES IN CALCIUM AND SODIUM (frame 36)

Site is under construction

Book navigation

  • Introduction to First Edition
  • 1.0.0 Generation of the ECG
  • 2.0.0 The Normal Electrocardiogram
  • 3.0.0 Inter and intra-ventricular Conduction Disturbances
  • 4.0.0 Ventricular Hypertrophy
  • 5.0.0 ELECTROLYTE ABNORMALITIES, DRUG EFFECTS AND THE LONG QT SYNDROMES
    • 5.1.0 Ion Channel R review (frame 1)
    • 5.2.0 High Potassium (9)
    • 5.2.10 (frame 19)
    • 5.3.0 low potassium (frame 28)
      • 5.3.1 (29)
      • 5.3.2(30)
      • 5.3.3 (31)
      • 5.3.4 (THIS IS FRAME 34)
      • 5.3.5 (33)
    • 5.4.0 CHANGES IN CALCIUM AND SODIUM (frame 36)
    • 5.5.0 Drug effects (frame 45)
    • 5.6.0 (frame 96) Hypothermia
    • 5.7.0 Brugada syndrome frame 116
  • 6.0.0 Ischemia and Infarction - Introduction (frame i and ii)
  • 7.0.0 Tachycardias- Introduction
  • 8.0.0 The Bradycardias frame i-introduction
  • 9.0.0 The ECG of Heart Murmurs-introduction
  • 10.0.0 The Electrocardiogram in the Emergency Department-Introduction
Powered by Drupal