
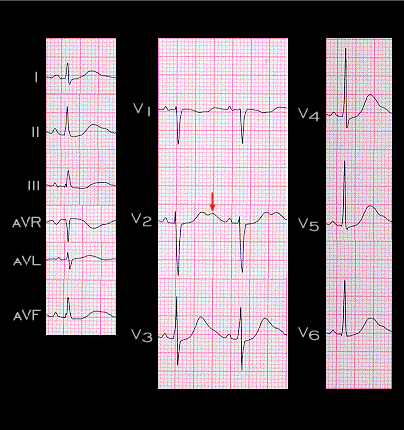
This ECG was recorded on the same patient when her serum potassium had fallen further to 2.7 mM. The U waves, located on the downslope of the T waves, are seen best in lead V2 (arrow). They are now abnormally prominent. Their amplitude almost equals that of the T wave and extends almost to the onset of the next P wave. This is the characteristic ECG abnormality of a decrease in the concentration of extracellular potassium.