
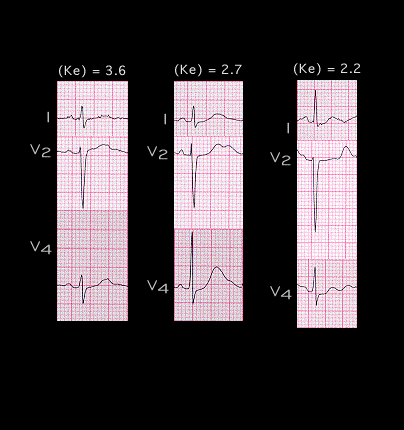
Selected leads from the three tracings recorded on this patient when the serum potassium concentration was 3.6, 2.7 and 2.2 mM are shown again here. The primary electrocardiographic changes associated with hypopotassemia are localised to the ST segment, T and U waves and include increased prominence of the U wave, lowering and inversion of the T wave and depression of the ST segment.