
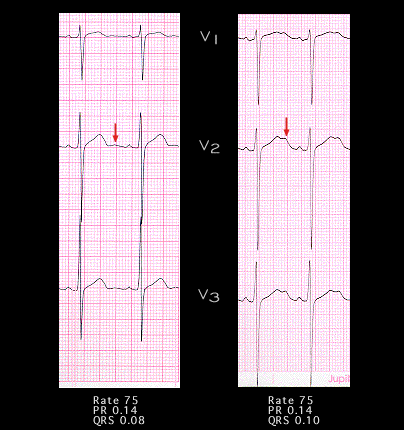
The ECG leads shown here illustrate another example of hypopotassemia. The leads on the left are normal. Note that the QRS duration is 0.08 seconds and that there is a small normal U wave (arrow)in lead V2. The leads on the right are from the ECG recorded when the serum potassium was 2.2 mM. Tthe QRS duration has increased slightly to 0.10 seconds and that there is a very prominent U wave in leads V2 and V3 (arrows) whose amplitude approaches that of the T wave. The PR interval is unchanged*. Slight widening of the QRS complex may occur in severe hypopotassemia and is probably a manifestation of the increased time required to depolarize the membrane from its hyperpolarized resting membrane potential to the threshold potential. The amplitude of the U wave in the mid precordial leads should equal that of the T wave before a diagnosis of hypopotassemia can be made with confidence.
* Note the differences in the R and S wave amplitudes in the 2 tracings. These are most likely explained by a slight difference in the placement of the electrodes on the chest.