Home
Understanding the Electrocardiogram

Main navigation

  • Home
  • Understanding ECGs
    • Introduction
User account menu
  • Log in

Breadcrumb

  1. Home
  2. Understanding the Electrocardiogram In Health & Disease
  3. 5.0.0 ELECTROLYTE ABNORMALITIES, DRUG EFFECTS AND THE LONG QT SYNDROMES
  4. 5.3.0 low potassium (frame 28)

5.3.2(30)

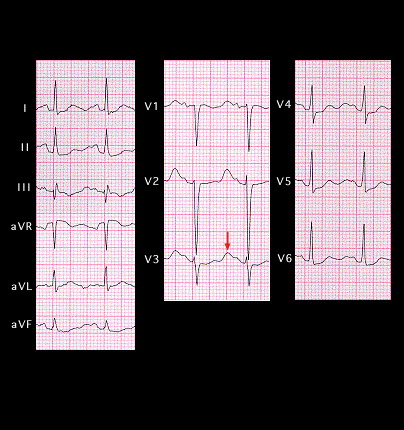
This ECG is from the same patient and was recorded when the serum potassium was 2.2.mM. There is now a loss of T wave amplitude and an even more pronounced U wave (arrow) whose amplitude now exceeds that of the T wave in leads V1-V5. There is also depression of the ST segment in leads V4, V5 and V6. The P wave, PR interval, and QRS complex remain normal.

Book traversal links for 5.3.2(30)

  • 5.3.1 (29)
  • Up
  • 5.3.3 (31)

Site is under construction

Book navigation

  • Introduction to First Edition
  • 1.0.0 Generation of the ECG
  • 2.0.0 The Normal Electrocardiogram
  • 3.0.0 Inter and intra-ventricular Conduction Disturbances
  • 4.0.0 Ventricular Hypertrophy
  • 5.0.0 ELECTROLYTE ABNORMALITIES, DRUG EFFECTS AND THE LONG QT SYNDROMES
    • 5.1.0 Ion Channel R review (frame 1)
    • 5.2.0 High Potassium (9)
    • 5.2.10 (frame 19)
    • 5.3.0 low potassium (frame 28)
      • 5.3.1 (29)
      • 5.3.2(30)
      • 5.3.3 (31)
      • 5.3.4 (THIS IS FRAME 34)
      • 5.3.5 (33)
    • 5.4.0 CHANGES IN CALCIUM AND SODIUM (frame 36)
    • 5.5.0 Drug effects (frame 45)
    • 5.6.0 (frame 96) Hypothermia
    • 5.7.0 Brugada syndrome frame 116
  • 6.0.0 Ischemia and Infarction - Introduction (frame i and ii)
  • 7.0.0 Tachycardias- Introduction
  • 8.0.0 The Bradycardias frame i-introduction
  • 9.0.0 The ECG of Heart Murmurs-introduction
  • 10.0.0 The Electrocardiogram in the Emergency Department-Introduction
Powered by Drupal