Home
Understanding the Electrocardiogram

Main navigation

  • Home
  • Understanding ECGs
    • Introduction
User account menu
  • Log in

Breadcrumb

  1. Home
  2. Understanding the Electrocardiogram In Health & Disease
  3. 3.0.0 Inter and intra-ventricular Conduction Disturbances
  4. 3.2.0 Left Bundle Branch Block (LBBB)

3.2.4 (23)

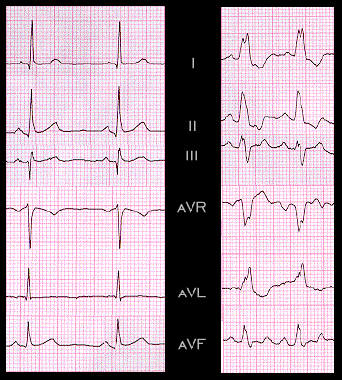
The limb leads shown here were taken on the same patient before and after the development of left bundle branch block. The QRS complex is prolonged by 60 msec from approximately 90 msec on the left, the normal tracing, to approximatgly 150 msec on the right, the tracing showing left bundle branch block. Note  also the loss of the early forces with the onset of the left bundle branch block indicating the loss of normal septal activation, and the secondary ST segment and T wave changes. The frontal plane axis is not significantly changed.

Book traversal links for 3.2.4 (23)

  • 3.2.3 (22)
  • Up
  • 3.2.5 (24)

Site is under construction

Book navigation

  • Introduction to First Edition
  • 1.0.0 Generation of the ECG
  • 2.0.0 The Normal Electrocardiogram
  • 3.0.0 Inter and intra-ventricular Conduction Disturbances
    • 3.0.1 Introduction Continued
    • 3.1.0 Right Bundle Branch Block (RBBB)
    • 3.2.0 Left Bundle Branch Block (LBBB)
      • 3.2.1 (20)
      • 3.2.2 (21)
      • 3.2.3 (22)
      • 3.2.4 (23)
      • 3.2.5 (24)
      • 3.2.6 (25)
      • 3.2.7 (26)
      • 3.2.8 (28-frame 27 is omitted)
    • 3.3.0 Fascicular blocks (frame 29)
    • 3.4.0 Aberrant Ventricular Conduction (52)
    • 3.5.0 Ventricular Pre-excitation (77)
  • 4.0.0 Ventricular Hypertrophy
  • 5.0.0 ELECTROLYTE ABNORMALITIES, DRUG EFFECTS AND THE LONG QT SYNDROMES
  • 6.0.0 Ischemia and Infarction - Introduction (frame i and ii)
  • 7.0.0 Tachycardias- Introduction
  • 8.0.0 The Bradycardias frame i-introduction
  • 9.0.0 The ECG of Heart Murmurs-introduction
  • 10.0.0 The Electrocardiogram in the Emergency Department-Introduction
Powered by Drupal