Home
Understanding the Electrocardiogram

Main navigation

  • Home
  • Understanding ECGs
    • Introduction
User account menu
  • Log in

Breadcrumb

  1. Home
  2. Understanding the Electrocardiogram In Health & Disease
  3. 5.0.0 ELECTROLYTE ABNORMALITIES, DRUG EFFECTS AND THE LONG QT SYNDROMES
  4. 5.4.0 CHANGES IN CALCIUM AND SODIUM (frame 36)

5.4.7 (43)

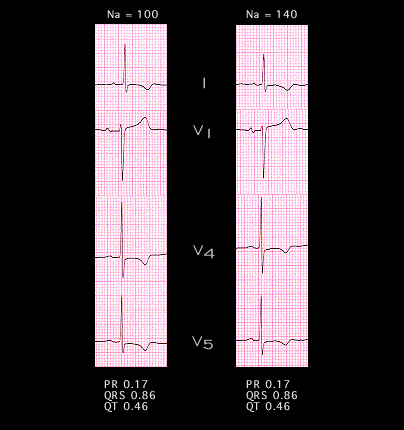
The ECGs from which these leads were taken are from the same patient, recorded on two successive days. The tracing on the left was recorded when the serum sodium was 100 mM. The tracing on the right was recorded the next day when the serum sodium was 140 mM. There were no other electrolyte abnormalities. There are no differences in the two tracings. The QRS duration is 0.86 seconds in both.

Book traversal links for 5.4.7 (43)

  • 5.4.6 (42)
  • Up
  • 5.4.8 (44)

Site is under construction

Book navigation

  • Introduction to First Edition
  • 1.0.0 Generation of the ECG
  • 2.0.0 The Normal Electrocardiogram
  • 3.0.0 Inter and intra-ventricular Conduction Disturbances
  • 4.0.0 Ventricular Hypertrophy
  • 5.0.0 ELECTROLYTE ABNORMALITIES, DRUG EFFECTS AND THE LONG QT SYNDROMES
    • 5.1.0 Ion Channel R review (frame 1)
    • 5.2.0 High Potassium (9)
    • 5.2.10 (frame 19)
    • 5.3.0 low potassium (frame 28)
    • 5.4.0 CHANGES IN CALCIUM AND SODIUM (frame 36)
      • 5.4.1 (37)
      • 5.4.2(38)
      • 5.4.3 (39)
      • 5.4.4 (40)
      • 5.4.5 (41)
      • 5.4.6 (42)
      • 5.4.7 (43)
      • 5.4.8 (44)
      • Electrolyte Abnormality Quiz
      • Electrolyte Abnormality Quiz Answers
    • 5.5.0 Drug effects (frame 45)
    • 5.6.0 (frame 96) Hypothermia
    • 5.7.0 Brugada syndrome frame 116
  • 6.0.0 Ischemia and Infarction - Introduction (frame i and ii)
  • 7.0.0 Tachycardias- Introduction
  • 8.0.0 The Bradycardias frame i-introduction
  • 9.0.0 The ECG of Heart Murmurs-introduction
  • 10.0.0 The Electrocardiogram in the Emergency Department-Introduction
Powered by Drupal