
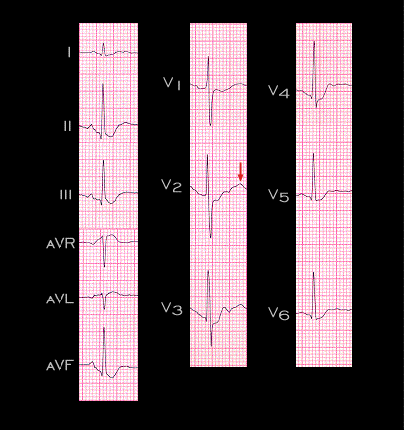
When changes in serum potassium and calcium occur together, the electrocardiogram will reflect the changes associated with each since each affects different portions of the action potential. The ECG shown here is from a 71 year of female with metastatic carcinoma and persistent vomiting. Her serum calcium level was 13.4 mg/dl and her serum potassium was 2.9 mM. The almost absent ST segment and short QT interval reflect the hypercalcemia while the prominent U waves (arrow), whose amplitude exceeds that of the T wave in leads V2, V3 and V4, reflect the hypopotassemia.