
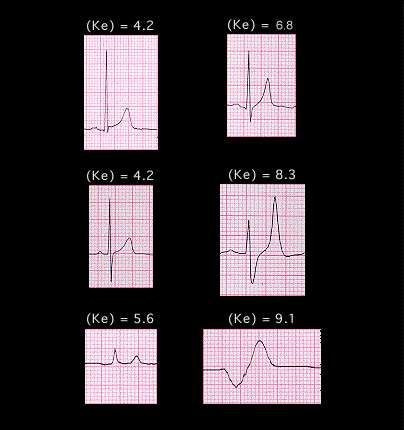
This group of electrocardiograms are shown again here to demonstrate the characteristic electrocardiographic changes associated with the progressive rise in extracellular potassium. The tracings in upper row are from the patient whose ECGS were shown on pages 5.2.0 and 5.5.1. The tracings in the lower 2 rows are from the patient whose tracings were shown on pages 5.2.3-5.2.6. All are lead V4 The first electrocardiographic manifestations of hyperpotassemia are peaking of the T wave and slight shortening of the QT interval. As potassium continues to rise, there is progressive widening of both the P wave and the QRS complex, sometimes with a shift in the electrical axis. Ultimately, the P wave becomes flat and may be undetectable and there is marked widening of the QRS complex which culminates in ventricular asystole or ventricular fibrillation and the death of the patient.