Home
Understanding the Electrocardiogram

Main navigation

  • Home
  • Understanding ECGs
    • Introduction
User account menu
  • Log in

Breadcrumb

  1. Home
  2. Understanding the Electrocardiogram In Health & Disease
  3. 5.0.0 ELECTROLYTE ABNORMALITIES, DRUG EFFECTS AND THE LONG QT SYNDROMES
  4. 5.2.0 High Potassium (9)

5.2.6 (15)

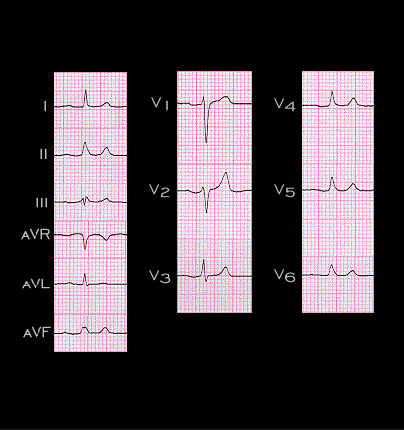
The hyperpotassemia was reversed by the intravenous administration of glucose and insulin and sodium bicarbonate and by hemodialysis. This ECG was recorded after the serum potassium had fallen to 5.6mM. P waves are now present. They are of low amplitude but are otherwise normal. The PR interval is 0.20 seconds, the QRS duration is now 0.08 seconds, the QT interval is 0.36 seconds and the tracing is normal.

Book traversal links for 5.2.6 (15)

  • 5.2.5(14)
  • Up
  • 5.2.7(16)

Site is under construction

Book navigation

  • Introduction to First Edition
  • 1.0.0 Generation of the ECG
  • 2.0.0 The Normal Electrocardiogram
  • 3.0.0 Inter and intra-ventricular Conduction Disturbances
  • 4.0.0 Ventricular Hypertrophy
  • 5.0.0 ELECTROLYTE ABNORMALITIES, DRUG EFFECTS AND THE LONG QT SYNDROMES
    • 5.1.0 Ion Channel R review (frame 1)
    • 5.2.0 High Potassium (9)
      • 5.2.1 (10)
      • 5.2.2(frame 11)
      • 5.2.3 (12)
      • 5.2.4 (13)
      • 5.2.5(14)
      • 5.2.6 (15)
      • 5.2.7(16)
      • 5.2.8(17)
      • 5.2.9 (18)
    • 5.2.10 (frame 19)
    • 5.3.0 low potassium (frame 28)
    • 5.4.0 CHANGES IN CALCIUM AND SODIUM (frame 36)
    • 5.5.0 Drug effects (frame 45)
    • 5.6.0 (frame 96) Hypothermia
    • 5.7.0 Brugada syndrome frame 116
  • 6.0.0 Ischemia and Infarction - Introduction (frame i and ii)
  • 7.0.0 Tachycardias- Introduction
  • 8.0.0 The Bradycardias frame i-introduction
  • 9.0.0 The ECG of Heart Murmurs-introduction
  • 10.0.0 The Electrocardiogram in the Emergency Department-Introduction
Powered by Drupal