
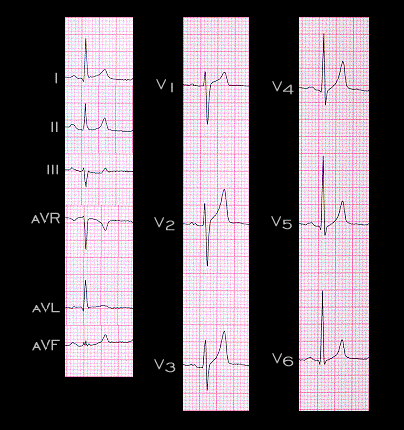
This ECG was recorded from the same patient a few months later. At this time, his serum potassium concentration was 6.8.mM and the T waves are more peaked and symmetrical than on the earlier tracing. These T wave changes are characteristic of a rise in extracellular potassium concentration to within the range of 6.0-7.0 mM.