
[ADD ARROWS TO SHOW THE 2nd P WAVE]
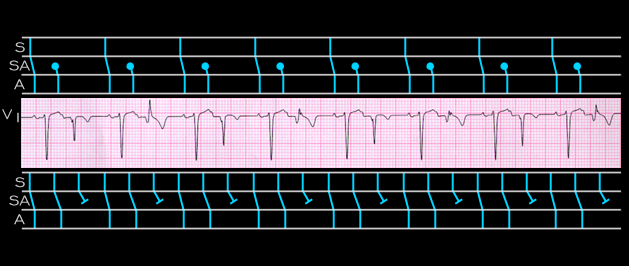
The tracing shown here also reveals groups of two with varying degrees of aberrant conduction in the second QRS of each pair. There is a P wave (arrow) before each of these QRS complexes but they are not obvious and their shape is difficult to determine because they fall in the preceding T wave. In lead V1, where the P waves are most obvious, their waveform appears quite similar to that of the sinus P wave.
There are 2 possible interpretations of this tracing and these are depicted in the ladder diagrams above and below the tracing. The first, depicted in the upper diagram, is that there is atrial bigeminy from an ectopic focus that is located in close proximity to the sinus node and that this results in an ectopic P wave whose wave form is similar to that of the sinus P wave. The second possible interpretation is that there is sinus tachycardia with an SS interval of 0.35 seconds (sinus discharge rate =178) and type I 3:2 SA block. This possibility is depicted in the lower ladder diagram.