
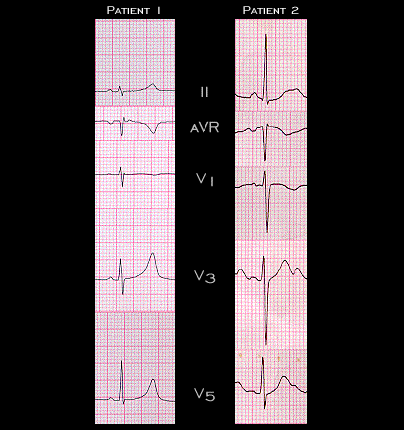
The tracings from the 2 young women with long QT are shown together here to illustrate the electrocardiographic differences in patients with the types 1 or 2 (the tracing on the right) and with type 3 (the tracing on the left) congenital long QT syndrome. Just as the tracing on the left, from the patient with type 3 long QT, resembles and is often mistaken for the electrocardiographic manifestation of hypocalcemia, the tracing on the right, from the patient with type 2 long QT, closely resembles and is often misdiagnosed as that caused by hypopotassemia.