Home
Understanding the Electrocardiogram

Main navigation

  • Home
  • Understanding ECGs
    • Introduction
User account menu
  • Log in

Breadcrumb

  1. Home
  2. Understanding the Electrocardiogram In Health & Disease
  3. 10.0.0 The Electrocardiogram in the Emergency Department-Introduction
  4. 10.3.0 Palpitations (frame 31)

10.3.8 (39)

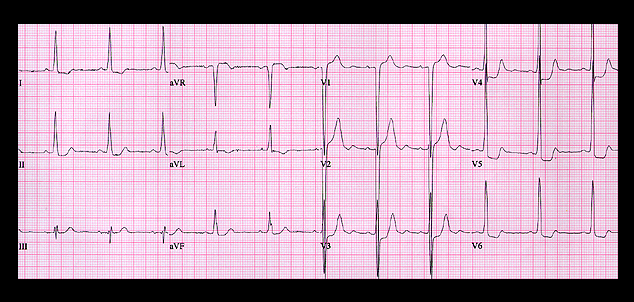
This ECG is from the same patient. It was recorded during sinus rhythm when the rate was 70 per minute (RR interval = 0.88 seconds). The QRS duration is now 0.09 seconds (90 msec) compared to the QRS durations of 0.10 to 0.13 seconds -depending on the RR intervals- shown on the previous tracing. In addition, the tracing shows QRS, ST segment  and T wave changes that are consistent with left ventricular hypertrophy.

Book traversal links for 10.3.8 (39)

  • 10.3.7 (37-again)
  • Up
  • 10.4.0 confusion, weakness etc (frame 40)

Site is under construction

Book navigation

  • Introduction to First Edition
  • 1.0.0 Generation of the ECG
  • 2.0.0 The Normal Electrocardiogram
  • 3.0.0 Inter and intra-ventricular Conduction Disturbances
  • 4.0.0 Ventricular Hypertrophy
  • 5.0.0 ELECTROLYTE ABNORMALITIES, DRUG EFFECTS AND THE LONG QT SYNDROMES
  • 6.0.0 Ischemia and Infarction - Introduction (frame i and ii)
  • 7.0.0 Tachycardias- Introduction
  • 8.0.0 The Bradycardias frame i-introduction
  • 9.0.0 The ECG of Heart Murmurs-introduction
  • 10.0.0 The Electrocardiogram in the Emergency Department-Introduction
    • 10.1.0 Chest pain (1)
    • 10.2.0 Shortness of breath (frame 23)
    • 10.3.0 Palpitations (frame 31)
      • 10.3.1 (32)
      • 10.3.2 (33)
      • 10.3.3 (34)
      • 10.3.4 (35)
      • 10.3.5 (36)
      • 10.3.6 (37)
      • 10.3.7 (37-again)
      • 10.3.8 (39)
    • 10.4.0 confusion, weakness etc (frame 40)
    • 10.5.0 Conclusion (no image)
Powered by Drupal