Home
Understanding the Electrocardiogram

Main navigation

  • Home
  • Understanding ECGs
    • Introduction
User account menu
  • Log in

Breadcrumb

  1. Home
  2. Understanding the Electrocardiogram In Health & Disease
  3. 9.0.0 The ECG of Heart Murmurs-introduction
  4. 9.3.0 Systolic and Diastolic Murmurs (frame 43)

9.3.6 (49)

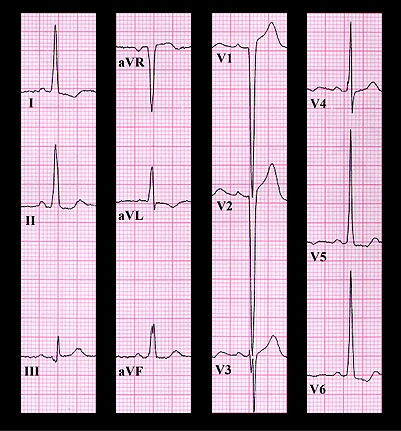
The ECG, shown again here, is a classic example of left ventricular hypertrophy with deep S waves in leads V1 and V2, tall R waves on leads V5 and V6, prolongation of the QRS duration and depression of the ST segment. The murmurs are those of aortic stenosis and insufficiency and the presence of left ventricular hypertrophy suggests that the lesions are severe. Indeed, a systolic gradient of 100 mm Hg was demonstrated across her aortic valve and there was significant aortic insufficiency.

Book traversal links for 9.3.6 (49)

  • 9.3.5 (48)
  • Up
  • 10.0.0 The Electrocardiogram in the Emergency Department-Introduction

Site is under construction

Book navigation

  • Introduction to First Edition
  • 1.0.0 Generation of the ECG
  • 2.0.0 The Normal Electrocardiogram
  • 3.0.0 Inter and intra-ventricular Conduction Disturbances
  • 4.0.0 Ventricular Hypertrophy
  • 5.0.0 ELECTROLYTE ABNORMALITIES, DRUG EFFECTS AND THE LONG QT SYNDROMES
  • 6.0.0 Ischemia and Infarction - Introduction (frame i and ii)
  • 7.0.0 Tachycardias- Introduction
  • 8.0.0 The Bradycardias frame i-introduction
  • 9.0.0 The ECG of Heart Murmurs-introduction
    • 9.0.1 (frame 1)
    • 9.0.2 (2)
    • 9.1.0 Systolic Heart Murmurs (frame 3)
    • 9.2.0 Diastolic Murmurs (frame 38)
    • 9.3.0 Systolic and Diastolic Murmurs (frame 43)
      • 9.3.1 (44)
      • 9.3.2 (45)
      • 9.3.3 (46)
      • 9.3.4 (47)
      • 9.3.5 (48)
      • 9.3.6 (49)
  • 10.0.0 The Electrocardiogram in the Emergency Department-Introduction
Powered by Drupal