Home
Understanding the Electrocardiogram

Main navigation

  • Home
  • Understanding ECGs
    • Introduction
User account menu
  • Log in

Breadcrumb

  1. Home
  2. Understanding the Electrocardiogram In Health & Disease
  3. 7.0.0 Tachycardias- Introduction
  4. 7.3.0 Atrial Flutter and Fibrillation (frame 93)
  5. 7.3.20 (frame 113)

7.3.28 (121)

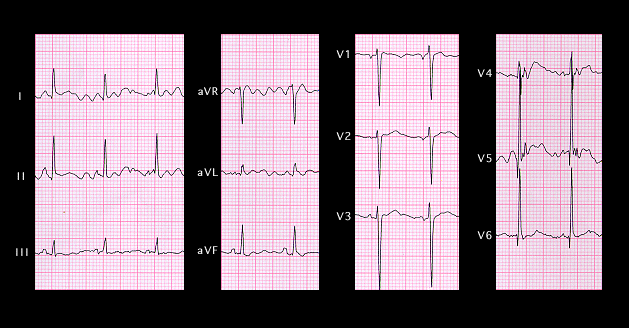
A second example is illustrated in this tracing. The P waves are quite clear in leads aVF, V1, V2 and V3, but in the other leads, the movement artifacts obscure the P waves and the tracing resembles atrial fibrillation.

Book traversal links for 7.3.28 (121)

  • 7.3.27 (120)
  • Up
  • 7.4.0 Wide Complex Beats and Rhythms (frame 122)

Site is under construction

Book navigation

  • Introduction to First Edition
  • 1.0.0 Generation of the ECG
  • 2.0.0 The Normal Electrocardiogram
  • 3.0.0 Inter and intra-ventricular Conduction Disturbances
  • 4.0.0 Ventricular Hypertrophy
  • 5.0.0 ELECTROLYTE ABNORMALITIES, DRUG EFFECTS AND THE LONG QT SYNDROMES
  • 6.0.0 Ischemia and Infarction - Introduction (frame i and ii)
  • 7.0.0 Tachycardias- Introduction
    • 7.1.0 Mechanisms of arrhythmias-frame 1
    • 7.2.0 Narrow Complex Rhythms (frame 38)
    • 7.3.0 Atrial Flutter and Fibrillation (frame 93)
      • 7.3.1 (94)
      • 7.3.2 (95)
      • 7.3.3 (96)
      • 7.3.4 (97)
      • 7.3.5 (98)
      • 7.3.6 (99)
      • 7.3.7 (100)
      • 7.3.8 (101)
      • 7.3.9 (102)
      • 7.3.10 (frame 103)
      • 7.3.20 (frame 113)
        • 7.3.21 (114)
        • 7.3.22 (115)
        • 7.3.23 (116)
        • 7.3.24 (117)
        • 7.3.25 (118)
        • 7.3.26 (119)
        • 7.3.27 (120)
        • 7.3.28 (121)
    • 7.4.0 Wide Complex Beats and Rhythms (frame 122)
  • 8.0.0 The Bradycardias frame i-introduction
  • 9.0.0 The ECG of Heart Murmurs-introduction
  • 10.0.0 The Electrocardiogram in the Emergency Department-Introduction
Powered by Drupal