Home
Understanding the Electrocardiogram

Main navigation

  • Home
  • Understanding ECGs
    • Introduction
User account menu
  • Log in

Breadcrumb

  1. Home
  2. Understanding the Electrocardiogram In Health & Disease
  3. 5.0.0 ELECTROLYTE ABNORMALITIES, DRUG EFFECTS AND THE LONG QT SYNDROMES
  4. 5.2.10 (frame 19)

5.2.17 (26)

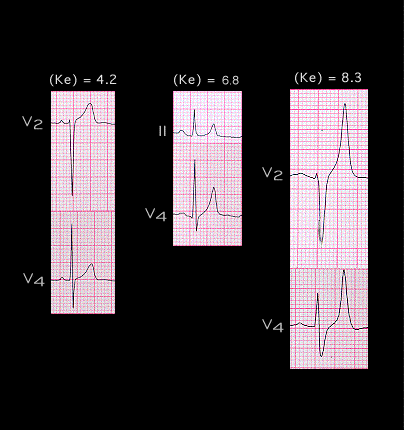
To review: At serum K levels between approximately 5.5 and 7.0 mM, the ECG changes are confined to peaking of the T wave and slight shortening of the QT interval. This reflects the increase in K conductance during the plateau phase and the phase of rapid repolarization and the fact that the resting potential has not become less negative than approximately -75 mV because at this level, the maximum rate of rise of the action potential upstroke has not decreased enough to cause conduction slowing. As K levels rise above 7.0 mM, the RMP becomes progressively less negative, dV/dt max decreases, conduction slows and the P wave and QRS complex become progressively widened. There may also be a shift in the electrical axis of the QRS complex indicating that conduction in some portions of the conducting system is slowed to a greater extent than in others.

Book traversal links for 5.2.17 (26)

  • 5.2.16 (25)
  • Up
  • 5.2.18 (27)

Site is under construction

Book navigation

  • Introduction to First Edition
  • 1.0.0 Generation of the ECG
  • 2.0.0 The Normal Electrocardiogram
  • 3.0.0 Inter and intra-ventricular Conduction Disturbances
  • 4.0.0 Ventricular Hypertrophy
  • 5.0.0 ELECTROLYTE ABNORMALITIES, DRUG EFFECTS AND THE LONG QT SYNDROMES
    • 5.1.0 Ion Channel R review (frame 1)
    • 5.2.0 High Potassium (9)
    • 5.2.10 (frame 19)
      • 5.2.11 (frame 20)
      • 5.2.12 (21)
      • 5.2.13 (22)
      • 5.2.14 (23)
      • 5.2.15 (24)
      • 5.2.16 (25)
      • 5.2.17 (26)
      • 5.2.18 (27)
    • 5.3.0 low potassium (frame 28)
    • 5.4.0 CHANGES IN CALCIUM AND SODIUM (frame 36)
    • 5.5.0 Drug effects (frame 45)
    • 5.6.0 (frame 96) Hypothermia
    • 5.7.0 Brugada syndrome frame 116
  • 6.0.0 Ischemia and Infarction - Introduction (frame i and ii)
  • 7.0.0 Tachycardias- Introduction
  • 8.0.0 The Bradycardias frame i-introduction
  • 9.0.0 The ECG of Heart Murmurs-introduction
  • 10.0.0 The Electrocardiogram in the Emergency Department-Introduction
Powered by Drupal